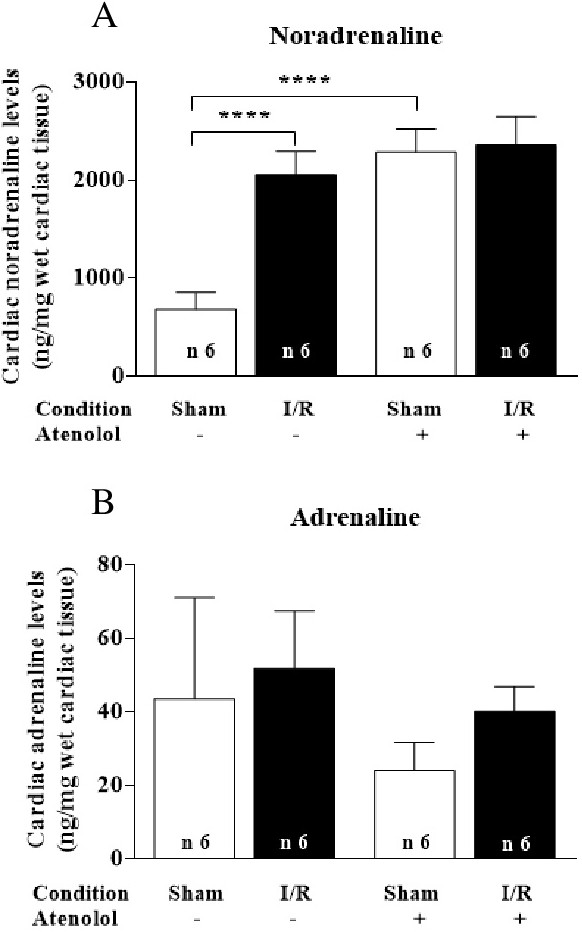
Fig. 6. Catecholamine levels in the heart tissue. Data are expressed as mean ± SD. The number of experiments using different preparations is indicated within each bar. Mice from Sham and I/R groups were treated with or without atenolol, as indicated on the abscissae. (A) Noradrenaline levels. (B) Adrenaline levels. ****P<0.0001 in A but no statistical differences in B, as assessed by one-factor ANOVA followed by Bonferroni's test for selected pairs.